Paraguay’s pesticide import grows despite adverse market
According to a Chinese Customs data report, China’s pesticide exports to Latin America in 2015 amounted to 384,040 tons, down 9% year-on-year, with an export value of US$1.83 billion, marking a drop for the second consecutive year and a 24% overall decline. China’s pesticide is exported to 27 countries of the 34 countries/regions in Latin America. The top 10 countries by export value are ranked as follows: Brazil, Argentina, Colombia, Paraguay, Mexico, Uruguay, Chile, Peru, Ecuador, and Guatemala. China’s pesticide export value to these 10 countries accounts for more than 87% of the total export value to Latin America, while its volume of exports accounts for some 90% of the total (Table 1).
?
In 2015, Brazil and Argentina remained the top two countries in Latin America to purchase the largest amount of pesticide from China for US$613.45 million and US$261.62 million, respectively, accounting for 34% and 14% of the total value of exports, down 48.82% and 67.16%, respectively, from 2014.
The Brazilian crop protection product sales of 2015 reached US$9.6 billion, down 21.56% year-on-year. According to an analysis by Sindiveg, the drop in sales was a result of a devalued Brazilian currency, major smuggling operations, increased difficulties faced by farmers in obtaining loans, and high stocks of goods held by manufacturers and distribution channels. The Brazilian currency was devalued by 50% in 2015, which came as a major shock to China’s pesticide exporters to Brazil.
A similar situation occurred in other Latin American countries, where the economies witnessed a slump: The currency was devalued, commodity prices fell, and the weather was unfavorable so planting structures were adjusted. As a result, China’s exports of pesticides to most Latin American countries suffered a drop, both in value and volume, with the only exception being Paraguay, where import volume from China grew 48.56%, prompting a rise in rankings to No.4 in 2015 from No.7 in 2014.
According to China’s Pesticide Export to Paraguay Analysis Report issued by AgroPages, as shown in Table 2, China’s exports of pesticide technical in 2015 amounted to $71.10 million, up 21% year-on-year, while volume increased by 67%. Formulations exported amounted to $58.95 million, marking a 3% drop year-on-year, although volume had increased 63%.

According to German Pessagno, COO of Paraguayan company Chemtec, agriculture has witnessed a global decline in recent years. Further, the Brazilian and Argentine currencies have been devalued, resulting in an increase in the export of farm products and a significant impact on the agricultural sector of Paraguay. In this highly agriculture-dependent country, the export of farm products contributes 20% of the GDP. Despite this unfavorable situation, the government is still providing inputs to the industry. As seen in 2015, loans issued to the industry increased by 33%, reaching $3,142 million, which stimulated further investment in production, including for agrochemical products. In 2015, the total imports of pesticide by Paraguay reached a historic record of 45,000 tons, worth $410 million, which also led to an increase in China’s pesticide exports to Paraguay. “Lots of agrochemicals were sold via Paraguay to other countries in Latin America,” said an industry insider, who believed that transit trade was another important reason for the increase in Paraguay’s imports of pesticide.
Analysis by Product?
New source of growth brought by weed resistance?
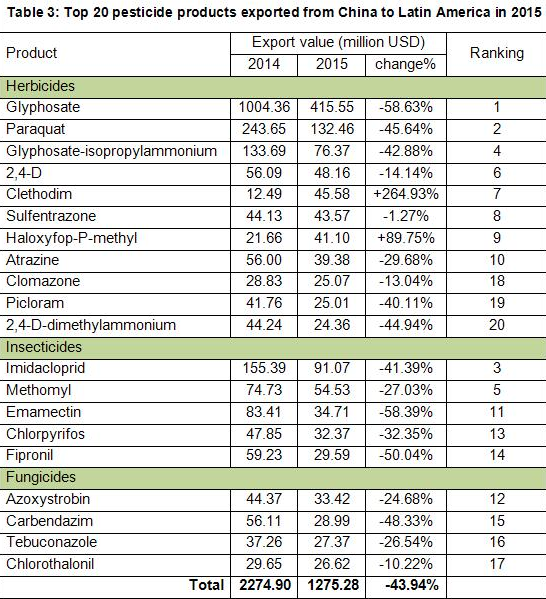
In 2015, China’s exports of pesticides to Latin America were still highly centralized, where the top 20 pesticide varieties accounted for 69.64% of the total exports to the region. The export value touched $1.28 billion and volume reached 353,270 tons, accounting for 70.76% of the total export volume, as shown in Table 3.?

Compared with 2014, China’s exports to Latin America in 2015 did not show much of a difference in product structure or variety. Herbicides still led exports by a wide margin. There were 11?herbicide?products among the top 20 export products, accounting for 72% of the export value. This was followed by four fungicide products, accounting for 9% of the export value, and five?insecticide?products, accounting for 19%.
